
High-volume data streams and a great number of reports for the real estate market was what we were confronted with on one of our client’s projects. More specifically, the client faced a tough scalability problem: the property market reports generated from such a big data set took up to 3 hours to produce (just for 100 markets). Worse, this time was increasing as each day a few million new records were fed to augment the data set. In a step to resolve the problem, the client decided to invest in a new system architecture.

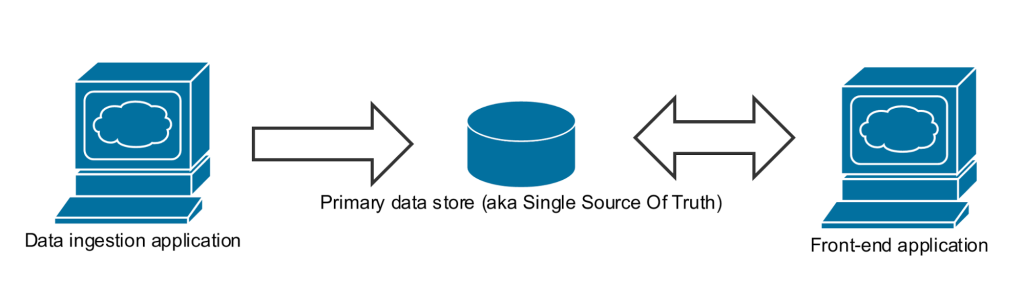
We started by dividing our work into three phases: investigation, development and optimization. During the first phase we explored the business domain and investigated data flows in the existing solution. One can study a simplified visualisation of the system architecture in the diagram below. Before moving forward, it is worth mentioning that the Single Source of Truth was a single instance of PostgreSQL database; it is important in this context due to the way in which geospatial queries (geo queries) were handled.
Some portions of the data were duplicated to another data store in order to group them on the basis of a predefined markets polygon. Then the grouped data acted as input source for the report generator. This idea is referred to as “polyglot persistence”, whereby for the sake of efficiency we move data to a different data store which is better in some specific way from the original source store. In this case the second data store used was ElasticSearch because the latter is a solid tool for performing fast and flexible data searching. Polyglot persistence is commonly used and it is perfectly fine to adopt but in this case where the data processing time of high volume data sets was a key factor, the tool was not sufficient any more. Yet another flaw we identified was with the main data store itself – it was on a heavy load (i.e., multiple connected clients were executing time consuming operations) as most of the business processes were executed against the main data store. When we finished the system examination and considered the different optimization scenarios at our hand, we drew the the following conclusions:
as regards data partitioning, group the data based on geo querying ahead of time
store the data from all the tables needed for reports on HDFS (a distributed file system)
migrate SQL reports to Apache Spark Jobs
run the reports only for markets where the data have actually changed
create an independent process responsible for data synchronization between PostgreSQL and HDFS
What did we aim to achieve after implementing the items above? Doing special geo queries based on a given polygon was expensive, even when using ElasticSearch. Grouping and partitioning the data ahead of time could give the system a nice performance boost. What is more, deploying Apache Spark could also improve performance as – with a sufficient number of nodes – we are in a position to load all the data into memory and run jobs (aka query from SQL perspective) in parallel, whereas PostgreSQL executes queries in a sequence, which slows the processing down.
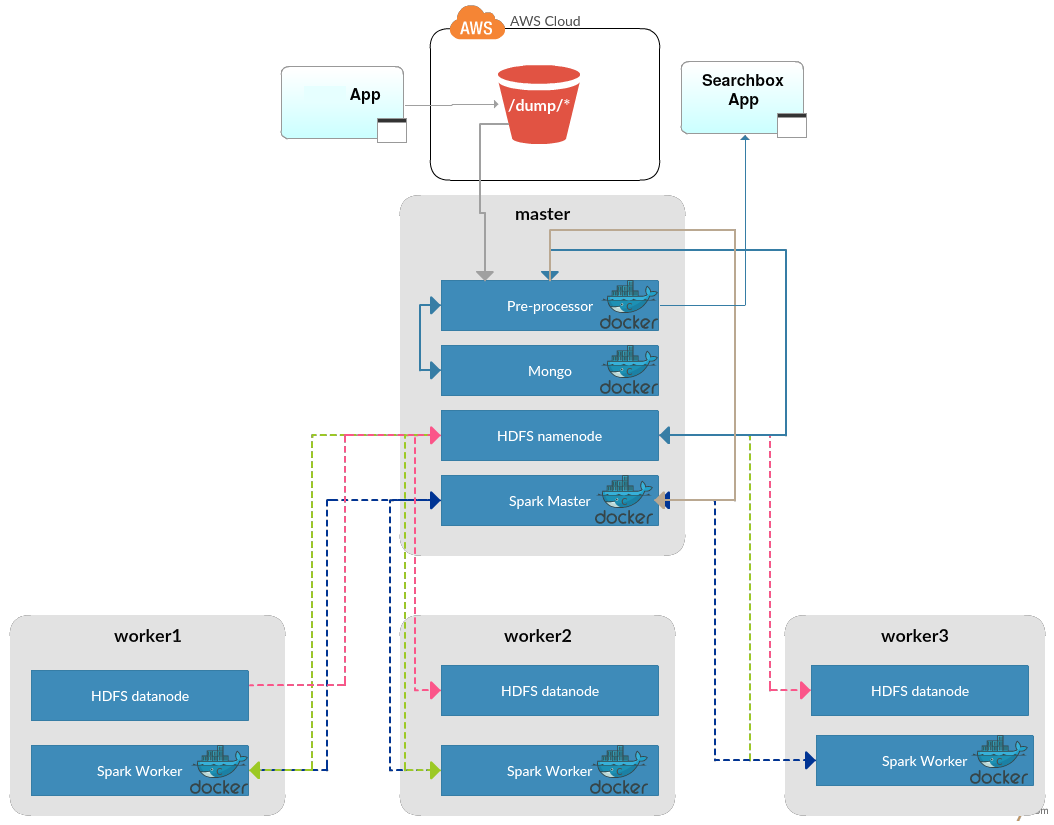
Before moving to the second phase we measured the existing solution to be able to compare the performance figures before and after the optimization we undertook to implement. It took ~2.7 hours to generate all the reports (10 reports X 100 markets X 10 sec SQL query execution time). We began the work by setting up a cluster on the DigitalOcean cloud platform which consists of 4 machines with the following responsibilities:
Node 1: Spark Master, HDFS namenode
Node 2: Spark Worker, HDFS datanode
Node 3: Spark Worker, HDFS datanode
Node 4: Spark Worker, HDFS datanode
Having the cluster in place, we started to synchronize the data between PostgreSQL and HDFS. During this step the data were grouped based on predefined polygon for each market (mentioned earlier). Having synchronized the data, we kept working on delivering one report after another in the following scrum iterations. The final design of the system architecture developed can be seen in the diagram below.
When the development phase was finished, we moved on to the final phase – optimization. At this stage we tested different Spark cluster settings to achieve the best performance results we could get. Having arrived at what we thought was a good configuration, we decided to measure the system performance and juxtapose the results with the measurements taken before implementation. The results were satisfying as the time needed to execute one report was reduced to 62 seconds and – interestingly – most of this processing time (60 seconds to be precise) was consumed by loading and caching the data into the Nodes memory. What is also very important here is that loading and caching was done just once per market! It now took only 2 sec to get a report itself, which was 5 times faster than with the solution before optimization. Another key point worth mentioning is that horizontal scaling just boils down to starting a new Spark Worker node and pointing it to the Spark Master Node – that’s it – job done.
All in all, we were quite happy with the results achieved with the optimization. What we also learned during this project is that you can write high quality code but if your cluster configuration is not adjusted, your efforts cannot make much difference.